
Figure 1.
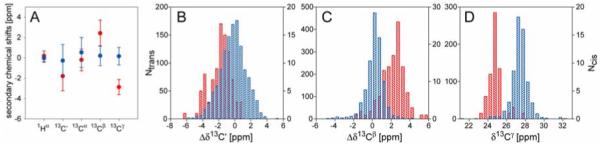
Chemical shift distribution for Pro residues in folded proteins. (A) Plot of the average 1Hα, 13C’, 13Cα, 13Cβ and 13Cγ secondary chemical shifts and their standard deviations for Pro with cis (red) or trans (blue) Xaa-Pro peptide bond. Δδ13Cγ are calculated using an average chemical shift of 27.28 ppm provided by BMRB, all other secondary chemical shifts are calculated relative to the random coil values taken from TALOS+ program (Shen et al. 2009a). (B-D) Histograms of 13C’ (B), 13Cβ (C) secondary chemical shifts and 13Cγ (D) chemical shifts of Pro residues preceded by a cis (red, right y-axis) or trans (blue, left y-axis) peptide bond.