Figure 5.
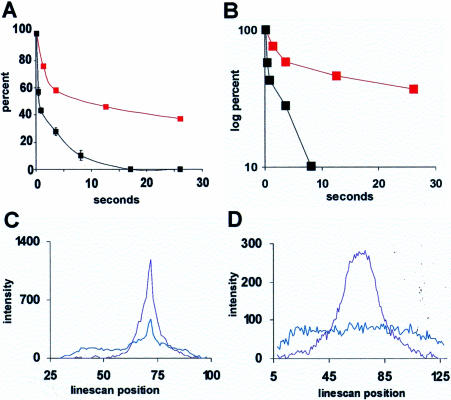
Measurement of signal intensity after uncaging. (A) The red curve shows the average percentage of uncaged anti-rRNA oligos remaining at a nucleolar uncaging site compared with the black curve showing the percentage of a nonhybridizing control oligo (oligo(dA); see Politz et al., 1999) remaining after uncaging in the nucleoplasm (control oligos do not localize to the nucleolus). The red curve here represents the average of 11 cells uncaged in one experiment, and similar results were obtained in four other experiments. (B) Same data as in A on a semilog plot. (C) Pixel intensities measured along a line drawn across the nucleus and the nucleolar uncaging site showing a Gaussian distribution of signal intensity at 110 msec (purple line) and 30 s (blue line) after uncaging. (D) Line intensity plot through center of an uncaged spot in nucleoplasm at 110 msec (purple) and 30 s (blue) after uncaging. The spatial distribution of signal after nucleoplasmic uncaging was similar at both 37 and 23°C.

