
Figure 5. Heat map and principal component analysis.
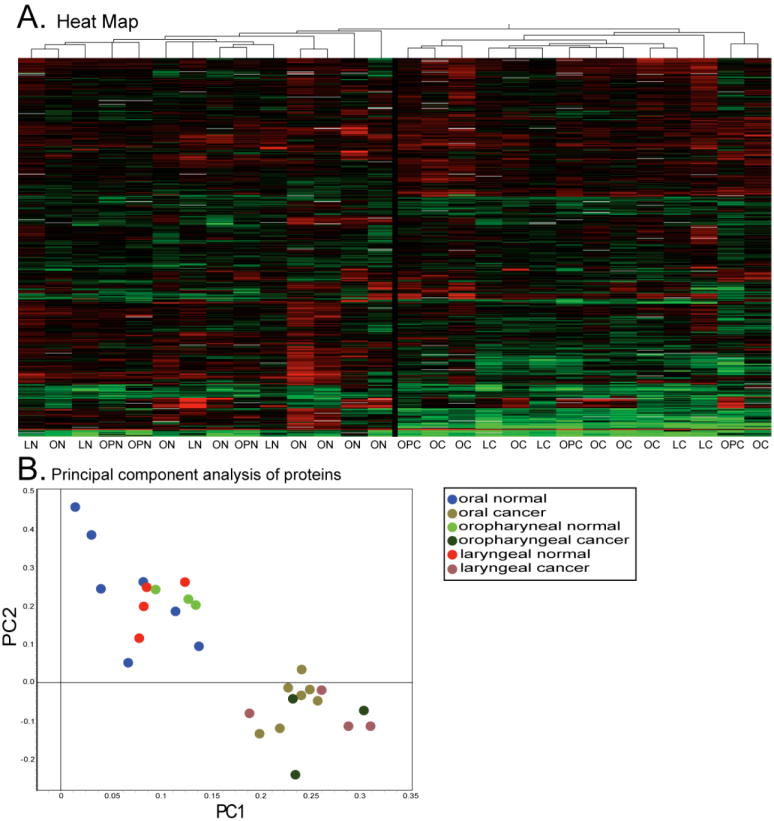
Panel A is a heat map representing the 732 proteins present on >90% of all gels. LN=Laryngeal Normal, LC=Laryngeal Cancer, ON=Oral Normal, OC=Oral Cancer, OPN=Oropharyngeal Normal, OPC=Oropharyngeal Cancer. The black line in the middle indicates separation of cancer and normal. B. Principal Component Analysis derived from the expression levels of the same 732 proteins.