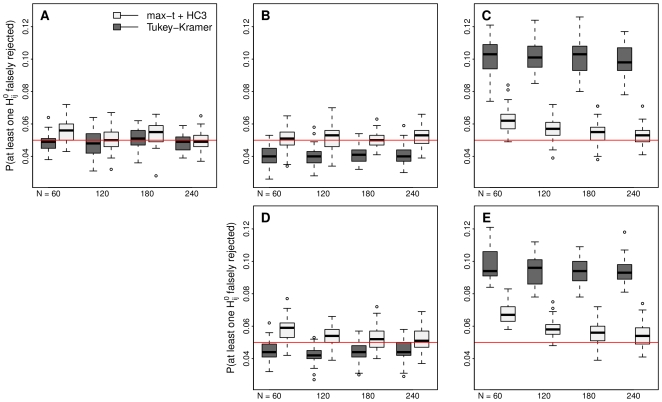
Figure 1. Familywise error rate of the simultaneous tests.
Estimated familywise error rate of the max- test using a heteroscedastic consistent covariance estimation (max-
 +HC3) and of the Tukey-Kramer test (Tukey-Kramer) assessing all pairwise comparisons of group effects in models under homoscedasticity (A), under heteroscedasticity with smaller variances in the smaller groups (B, D) and under heteroscedasticity with smaller variances in the larger groups (C, E) for normal data (A, B, C) and non-normal data (D, E). The total number of observations
  was unbalancedly distributed to the four groups. The horizontal red line indicates the a-priori defined level
  .
.

