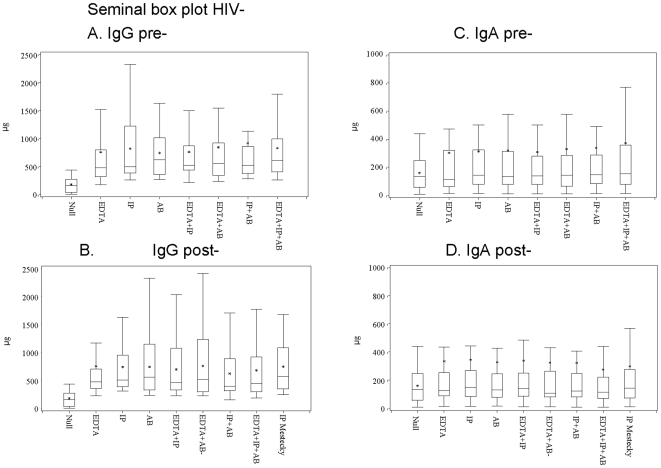
Figure 2. Immunoglobulin concentration in seminal fluids from Italian men.
Box plot summarizes the immunoglobulin concentrations (median and range) observed in seminal fluids from healthy donors, according to the Additives (cryopreservations only, single, double or triple additives) and the Processing Modes (addition of preserving agents made pre- or post-fluid incubation). All specimens were immediately processed after sampling; the values are given in microgram/mL. Panel legends: A. IgG range in pre-incubation samples; B. IgG range in post-incubation samples; C. IgA range in pre-incubation samples; D. IgA range in post-incubation samples. Additives legends: Null, cryopreservation only; EDTA: ethylenediaminetetraacetic acid; IP, protease inhibitors; AB, Antibiotics. Box legends: Box short sides represent the third (Q3) and the first quartile (Q1), respectively, while the asterisk (*) within the box indicates the mean and the horizontal bar (--) shows the median value, respectively. Vertical lines above or below the box indicate the corresponding quartile value (Q3 or Q1) plus or minus 1.5 times the interquartile interval (IQ = Q3−Q1).

