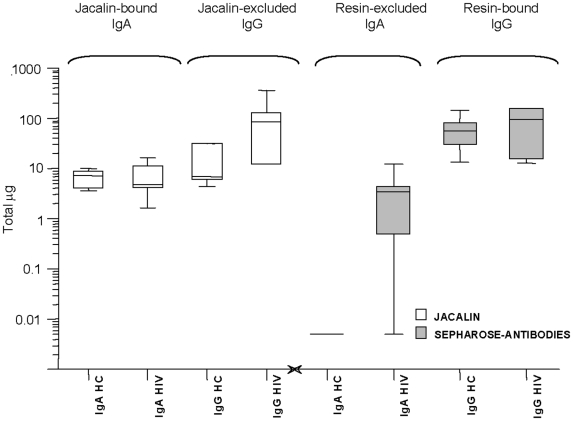
Figure 6. Three-step vs jacalin affinity purification of mucosal immunoglobulins.
Box plot comparing IgA and IgG immunoglobulin purification by two different methods assayed in the study. Left panel shows IgA and IgG values measured in jacalin-bound and -excluded fractions, respectively; right panel presents IgA and IgG values measured in the two bound fractions. Values are expressed in total micrograms per sample, in log-scale. From the left to the right, respectively: Jacalin–agarose purification (white box): IgA from healthy controls; IgA from HIV-positive subjects; IgG from healthy controls; IgG from HIV-positive subjects. Three-step affinity purification (grey box): IgA from healthy controls; IgA from HIV-positive subjects; IgG from healthy controls; IgG from HIV-positive subjects. Box legends: Box short sides represent the third (Q3) and the first quartile (Q1), respectively, while the horizontal bar (-) shows the median value. Vertical lines above or below the box indicate the corresponding quartile value (Q3 or Q1) plus or minus 1.5 times the interquartile interval (IQ = Q3−Q1).

