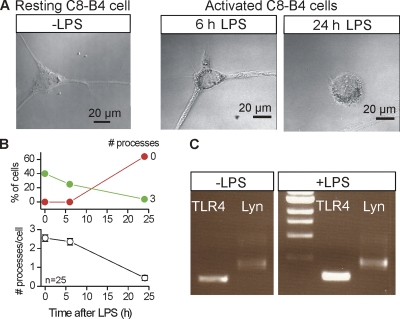
Figure 1.
Basic properties of resting and activated C8-B4 cells. (A) Representative images of C8-B4 cells in culture in the resting state as well as in the activated state at various time points after the addition of 1 µg/ml LPS. (B) The top graph shows the percentage of cells with 0 or 3 processes, whereas the bottom graph shows the average number of processes per cell as a function of time after the addition of 1 µg/ml LPS. The number of cells with three processes was significantly decreased by LPS. Thus, the images and graph clearly show that the activated state of C8-B4 cells is associated with the loss of processes. (C) The agarose gel image qualitatively shows RT-PCR results for two markers (TLR4 and Lyn tyrosine kinase), whose expression increased upon C8-B4 cell activation with the addition of LPS. All of the lanes were run on the same gel, but an unrelated intervening lane has been removed. This is shown as a break in the gel next to the molecular weight markers. This gel image is representative of three similar experiments.

