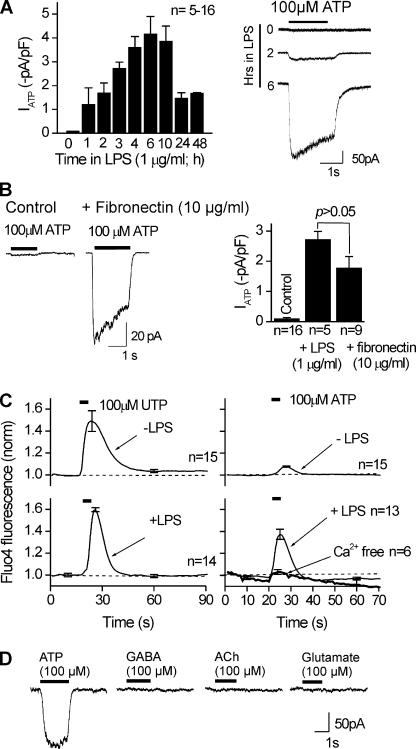
Figure 2.
Up-regulation of an ATP-gated inward current (at −60 mV) in activated C8-B4 cells. (A) The bar graph shows peak ATP-evoked currents (IATP) measured in response to 100-µM ATP applications for 2 s (at −60 mV) at different time points after initiation of the activated state by 1 µg/ml LPS. On the right are representative traces for the ATP-evoked responses at the indicated time points after the addition of LPS. The ATP-evoked inward currents increased with time after LPS, reaching a peak at 4–6 h. Subsequently, especially after 24–48 h after LPS, the ATP-evoked currents were far smaller and the cells were hard to maintain in the whole cell configuration. The remainder of the experiments in this paper use 3–6 h of activation by LPS. (B) Activation of C8-B4 cells by 10 µg/ml fibronectin and 1 µg/ml LPS results in similar increases in peak ATP-evoked currents. On the left are representative traces, and the bar graph shows summary data (n = 16, 5, and 9 for each bar of the graph). (C) 100-µM ATP- and 100-µM UTP-evoked increases in Fluo-4 fluorescence in resting (−LPS) and activated (+LPS) C8-B4 cells. The UTP effect was not increased in activated C8-B4 cells, whereas the effect of ATP was significantly increased. The ATP-evoked change in Fluo-4 fluorescence was largely reduced when the cells were bathed in nominally Ca2+-free buffer for the duration of the recordings shown (∼70 s; n = 6–15 for each graph). (D) The traces are representative of one cell (from seven similar experiments) and show that ATP-evoked currents were largely increased in activated C8-B4 cells, whereas currents evoked by GABA, ACh, or glutamate could not be detected.

