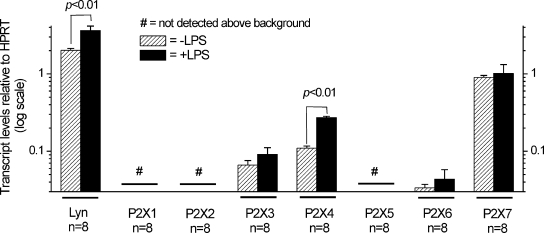
Figure 3.
Up-regulation of P2X4 transcripts in activated C8-B4 cells as revealed by qPCR. The bar graph summarizes qPCR experiments in control (−LPS) and activated C8-B4 cells (+LPS), with the data normalized to HPRT expression levels (see Materials and methods). By this analysis, only Lyn tyrosine kinase and P2X4 mRNA levels were elevated in activated C8-B4 cells. The bars represent mean ± SEM from n observations as indicated on the graph. Comparisons were made between control and activated C8-B4 cells using the unpaired Student’s t test, and significance was declared if P < 0.05. Note the y axis is on a log scale so that all of the data bars are easily visible on the same scale.

