Figure 6.
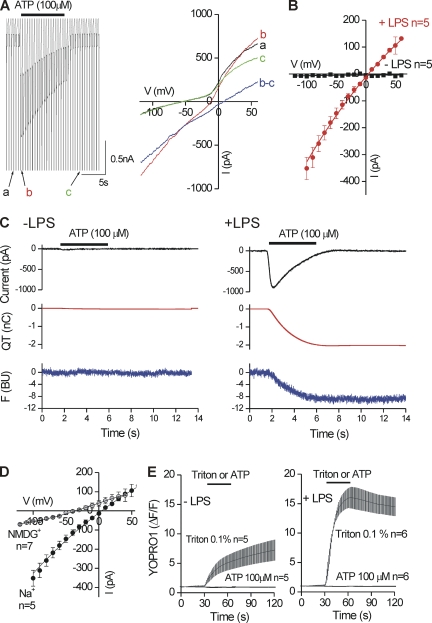
Properties of ATP-evoked currents in activated C8-B4 cells. (A; left) Concatenated traces of membrane voltage ramps applied before, during, and after the application of 100 µM ATP to a single activated C8-B4 cell. The traces labeled as a, b, and c are shown expanded on the current–voltage relation on the right. The current–voltage relation of the ATP-evoked current is shown in blue for this representative cell. For this, we used b–c to calculate IATP. (B) The average data for five resting and five activated C8-B4 cells. For activated C8-B4 cells, the ATP-evoked current was slightly inwardly rectifying and reversed direction at +5 mV. ATP failed to evoke any inward currents in resting C8-B4 cells. (C) The black traces are ATP-evoked currents (ampere units), the red traces are the integral of the current (QT in nC units), and the blue traces are the ΔF380 of FURA (in BUs). ATP evoked negligible inward currents and changes in FURA fluorescence in resting C8-B4 cells (−LPS), but it evoked significant inward currents and changes in FURA fluorescence in activated C8-B4 cells. Traces such as these were used to calculate the Pf% of the ATP-evoked currents in activated C8-B4 cells, as described in Materials and methods. (D) Current–voltage relations for 100-µM ATP-evoked currents in activated C8-B4 cells in the presence of NMDG+ as major extracellular cation. (E) Plots YOPRO1 fluorescence intensity over time for five and six resting and activated C8-B4 cells. 100 µM ATP failed to evoke YOPRO1 uptake in resting or activated C8-B4 cells, whereas cell permeabilization with 0.1% Triton did so. All of the ATP-evoked currents were measured at a holding voltage of −60 mV.

