Figure 7.
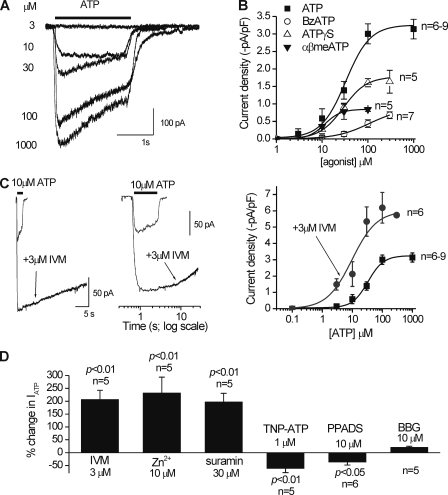
Pharmacological properties of ATP-evoked currents in activated C8-B4 cells. (A) Representative traces for concentration-dependent ATP-evoked inward currents recorded from activated C8-B4 cells. (B) Concentration–effect curves for ATP and three analogues. (C) Representative traces for the ability of 3 µM IVM to increase the peak and duration of 10-µM ATP-evoked responses recorded from activated C8-B4 cells. The graph to the right shows the effect of IVM on the ATP concentration–response curve. (D) Summary bar graph showing the effect of several known P2X modulators and antagonists on peak ATP-evoked responses recorded from individual activated C8-B4 cells (10 µM ATP was used in each case). The concentrations of the agents were: 3 µM IVM, 10 µM Zn2+, 30 µM suramin, 1 µM TNP-ATP, 10 µM PPADS, and 1 µM BBG. Each bar represents mean data between five and six cells. All of the ATP-evoked currents were measured at a holding voltage of −60 mV.

