Figure 9.
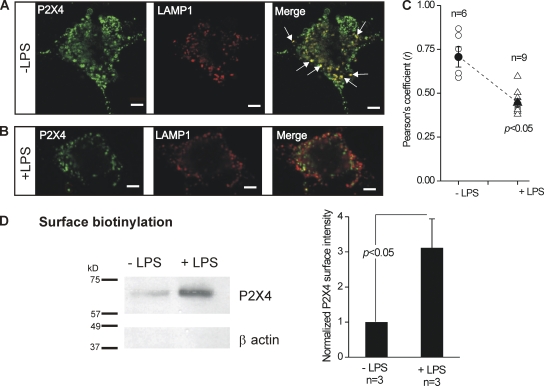
Reduced lysosomal colocalization and increased surface trafficking of P2X4 receptors in activated C8-B4 cells. (A) Representative confocal images show staining for P2X4 (left) and LAMP1 (middle), and costaining for these two epitopes in the merged image (right). In the right panel, the white arrows point to regions of strong colocalization between P2X4 and LAMP1. (B) Experiments similar to those shown in A, but for activated C8-B4 cells (+LPS). (C) Mean and individual values for the Pearson’s coefficient (r), which represents 0 and maximal colocalization between P2X4 and LAMP1 on a scale between 0 and 1 (see Results and Data analysis in Materials and methods). Note that there was a significant decrease in r for activated C8-B4 cells (+LPS). (D) The Western blot shows protein bands for P2X4 and β actin from membrane proteins isolated by surface biotinylation. No β actin staining was detected, confirming that the loaded proteins lacked cytosolic contamination. In the absence of LPS, a very weak band corresponding to P2X4 was seen. However, the intensity of this band was largely increased in activated C8-B4 cells. For any one gel, the bands were from samples loaded and resolved in the same gel, and the image of all bands was captured simultaneously. The bar graph to the right shows the average data for three experiments, such as those shown by the exemplar gel. There was a significant increase in surface P2X4 expression in activated C8-B4 cells as compared with resting C8-B4 cells. Bar, 10 µm.

