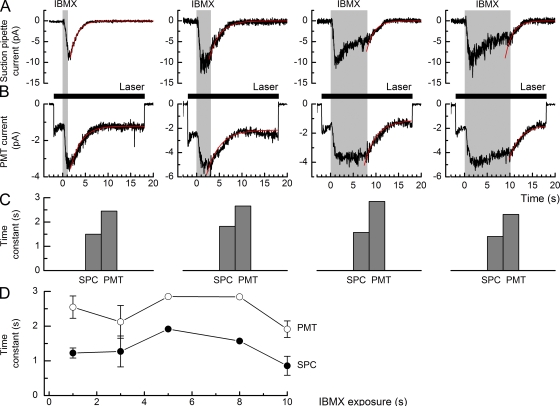
Figure 1.
Suction pipette and simultaneous intraciliary Ca2+ fluorescence recordings of IBMX-evoked responses in an isolated ORN. Representative recordings of (A) the suction pipette current (SPC) and (B) the PMT current evoked by 1-, 3-, 8-, and 10-s exposures of the same isolated ORN to 500 µM IBMX. Decaying single-exponential functions (solid red traces) were fitted to the recovery phase of each response using a least-squares algorithm. The PMT current, representing the Ca2+ dye signal, has been low-pass filtered at 10 Hz. Traces for the 1-, 3-, and 8-s IBMX exposures are each the average of three trials, and the recording for the 10-s IBMX exposure corresponds to a single trial. Gray bars denote the command for the presentation of the IBMX stimulus. Solid bars in B denote laser excitation of fluorescence. (C) Time constants for the decaying single-exponential functions fitted to the receptor current (suction pipette current) and PMT current traces for the cell in A and B. The mean ratio of the time constants fitted to the PMT and suction pipette current traces is 1.6 ± 0.2 for this cell. (D) Collected time constant data from experiments as in A and B for IBMX exposures of 1 s (10 cells), 3 s (3 cells), 5 s (1 cell), 8 s (1 cell), and 10 s (3 cells). Data points represent mean ± SEM. Statistical analysis was performed using the paired t test to compare the time constants fitted to the suction pipette and PMT current traces for a 1-s IBMX exposure and the Spearman rank correlation test to compare the time constants fitted to the current recovery after IBMX exposures of different durations.

