Figure 4.
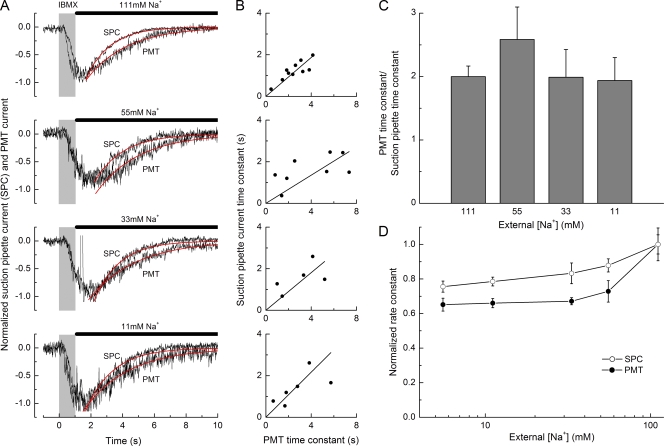
The modest effect of Na+ on receptor current recovery indicates that Na+–Ca2+ exchange is not the dominant mechanism for ciliary Ca2+ clearance. (A) Suction pipette and simultaneous Ca2+ fluorescence recordings from an isolated ORN stimulated for 1 s with 200 µM IBMX. After stimulation, the cell was allowed to recover with the cilia exposed to either normal Ringer’s solution (111 mM Na+) or in low Na+ guanidinium–substituted Ringer’s solution containing 55, 33, or 11 mM Na+. All traces have been normalized to their peak magnitude and the baseline corrected to the zero current level before stimulation. Single exponentials (red traces) have been fitted to the decay phases of the responses using a least-squares algorithm. Gray bars denote the command for the presentation of the IBMX stimulus. Solid bars denote presentation of solutions of modified Na+ concentration. (B) Time constant for the decay of the receptor current plotted against the time constant for decay of the PMT current Ca2+ fluorescence signal in the same cell for each external Na+ concentration. A linear function constrained to pass through the origin fitted to the data yielded slopes of 0.47 ± 0.03, 0.34 ± 0.06, 0.45 ± 0.09, and 0.54 ± 0.08 for 111, 55, 33, and 11 mM [Na+], respectively (5–10 cells per panel). Statistical analysis was performed using the Spearman rank correlation test to compare these slopes, which were not significantly affected by the Na+ concentration (r = −0.4; P > 0.1). (C) Average ratio between the time constants for the decay of the Ca2+ fluorescence signal and the corresponding receptor current at each Na+ concentration; each bar represents the mean of 5–10 cells. (D) Rate constants, calculated as the reciprocal of the mean time constants for recovery of the responses evoked by 1-s IBMX stimulation obtained as in A at different Na+ concentrations (including 5 mM, not shown in A). Rate constants were normalized to the rate constant in normal Ringer’s solution and averaged for each concentration: 4–18 cells for suction pipette current (SPC; open circles) and 3–10 cells for PMT current (filled circles). Error bars represent SEM.

