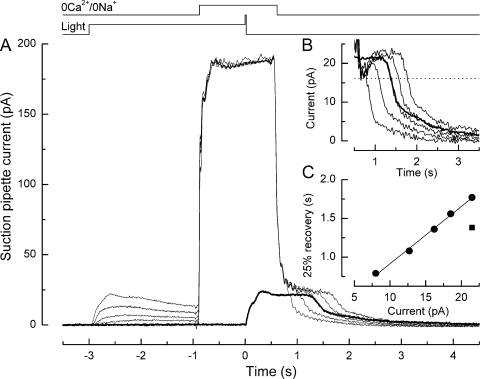
Figure 3.
Effect of prior steady illumination in Ringer's solution on the prolongation of the bright flash response in an L-cone by exposure to 0 Ca2+/0 Na+ solution. (A) Superimposed responses to bright flashes in Ringer's solution in darkness (heavy trace) or upon superfusion with 0 Ca2+/0 Na+ solution in darkness or after steady background illumination (light traces). The cone was exposed for 3 s to steady light, and then a bright flash was delivered and the background was extinguished. The solution superfusing the outer segment was rapidly changed from Ringer's solution to 0 Ca2+/0 Na+ solution 1 s before the flash, and then returned to Ringer's solution 600 ms thereafter. Each trace is the average of two responses in 0 Ca2+/0 Na+ solution and four responses in Ringer's solution; measurements were bracketed symmetrically in time. Top traces denote light and solution change monitors. Background intensities in 0 Ca2+/0 Na+ solution were 0, 6.00 × 10², 2.30 × 10³, 9.86 × 10³, and 3.96 × 10⁴ photons µm−2 s−1 at 578 nm, evoking background responses of progressively increasing amplitude and flash responses of progressively decreasing duration. Bright flashes delivered 1.22 × 10⁶ photons µm−2 at 578 nm. In 0 Ca2+/0 Na+ solution, sodium ions have been replaced with choline; the rising phase of the flash response in this solution is barely visible due to the virtual absence of permeant ions. (B) Recovery phases of the responses from A after subtraction of the junction current obtained upon the return to Ringer's solution after exposure to 0 Ca2+/0 Na+ solution during saturating light at the end of the experiment. Data have been digitally low-pass filtered at 20 Hz. Heavy trace denotes response in Ringer's solution. (C) Dependence of response duration after exposure to 0 Ca2+/0 Na+ solution on the circulating current during prior steady illumination (filled circles). Circulating current was measured in Ringer's solution just before the solution change. Response duration was measured as the time taken after the flash for the response to recover 25% of the original dark current in Ringer's solution (interrupted line in B); times of solution changes measured from the half-relaxation time of the junction current. Regression line fitted using a least-squares algorithm. Filled square represents time for 25% recovery of the flash response in Ringer's solution without prior background exposure.

