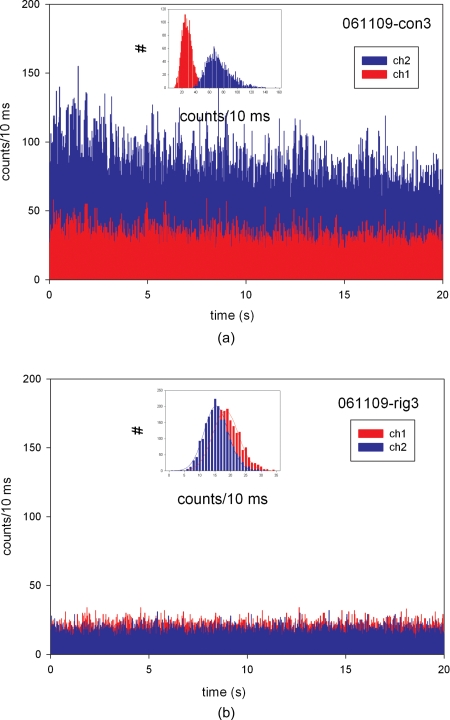
Figure 4.
Time traces from the left ventricle on gold-coated glass labeled with 10-nM rhodamine phalloidin+10-μM unlabeled phalloidin. (a) Contracting and (b) rigor muscle. Parallel (IH) and perpendicular (IV) intensities are shown in the blue and red, respectively. Insets show histograms of counts during (a) contraction and (b) rigor. Note that the Gaussian curve used to fit the contraction data is asymmetrical. (Color online only.)

