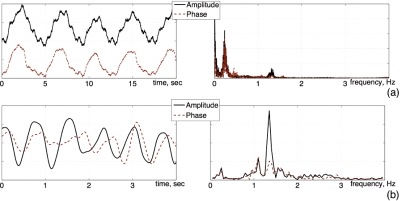
Figure 3.
Amplitude and phase shift of effective radar cross section of a human subject, proportional units. Left: time-domain plots. Right: Frequency-domain plots. (a) Respiration-filtered signal. 0.25 Hz peaks in both amplitude and phase frequency curves correspond to 15 breaths per minute. (b) Cardiac-filtered radar data. Frequency peaks at 1.3 Hz correspond to the heart rate of 78 bpm. Note the shorter time-domain display window: 0–4 s.

