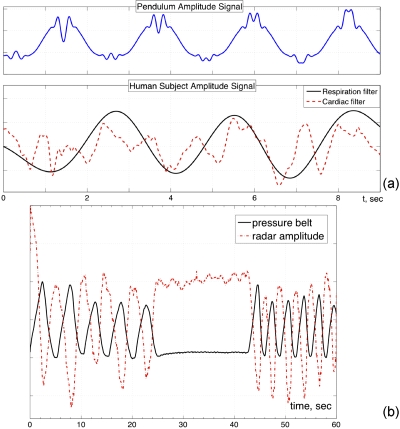
Figure 4.
All plots use arbitrary units. (a) MFMR used to measure the patient’s vital signs and the oscillation frequency of a pendulum. Top: Denoised pendulum signal, A10 (frequencies above 6 Hz cut off). Bottom: Human subject signal A20 filtered to amplify respiration (0.01–0.6 Hz band filter) and cardiac motion (0.6–6 Hz band filter). (b) Radar reflection off the subject’s hand vs pressure belt signal. Coached breathing pattern: five deep breaths at 5 s∕cycle, a 18 s breathhold, six breaths at 3 s∕cycle. The signals derived from the radar and from the respiration monitor belt clearly mirror each other.

