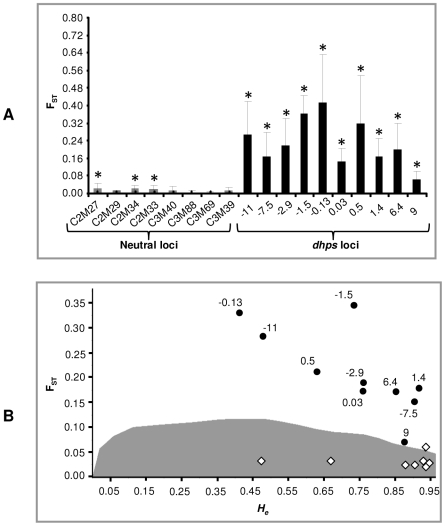
Figure 3. Comparison of FST across selected (dhps) and unselected (neutral) loci.
(A) Histogram plotting FST (±SD) values at 8 neutral (gray bars) and 10 dhps (black bars) microsatellite loci. Asterisk indicates significant values obtained after 1000 random permutations. Populations were defined according to their dhps genotype (i.e. wild type, single, double, or triple mutant) for calculations of the overall (global) FST. The overall FST for dhps after jackknifing over loci was 0.20 (95% CI: 0.15–0.26) whereas the overall FST for 8 neutral loci was 0.01 (95% CI: 0.006–0.019). The difference between FST values of dhps and neutral groups was highly significant as assessed by Mann-Whitney U test (Z = 3.55, P = 0.0003). (B) Plot of FST versus He to disentangle selection on dhps and neutral loci. Black circles represent 10 dhps loci and white diamonds represent 8 neutral loci. The gray shading indicates the region of neutral expectations at a confidence level of 95%. The markers above the gray region are considered to be under directional selection while those inside the gray region are considered to be neutral. The P values (simulated FST<sample FST) for each locus are given as supporting information (Table S4).

