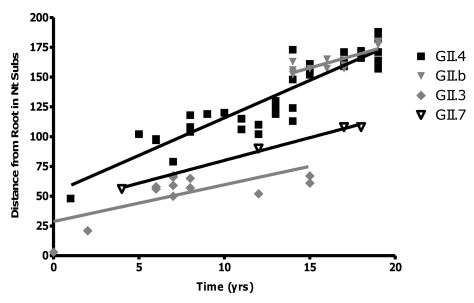
Figure 4. Rate of evolution for the GII.4, GII.7, GII.b/GII.3 and GII.3 strains.
The rate of evolution for each genotype was determined by calculating the number of nucleotide substitutions in ORF2 compared to the oldest strain in each lineage. The number of changes was then plotted against the year of that strains detection. The rate of evolution was equivalent to the gradient of the line (GII.4 = 6.30±0.39, r2 = 0.84; GII.b = 4.03±0.80, r2 = 0.68; GII.3 = 3.09±0.95, r2 = 0.49; GII.7 = 3.82±0.25, r2 = 0.99) divided by the length of the capsid gene (1623 bp for GII.4 and GII.7, and 1647 bp for GII.3 and GII.b/GII.3).

