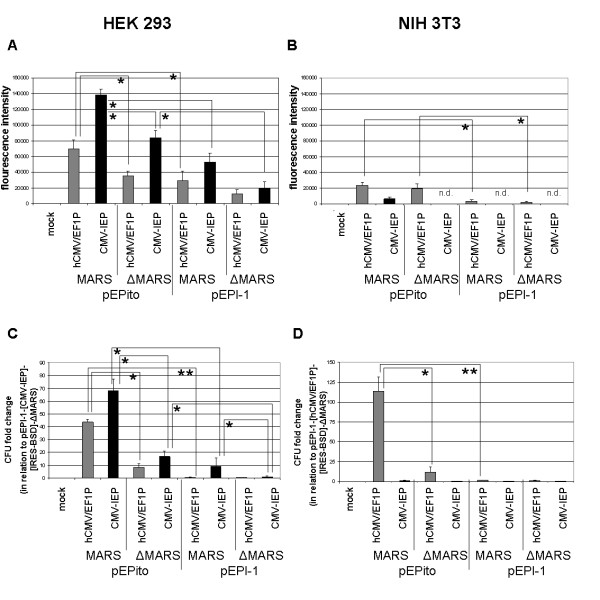
Figure 4.
Expression levels and colony formation efficiencies in stably selected HEK293 and NIH3T3 cells. (A, B) Mean EGFP expression levels per cell (A: HEK293, B: NIH3T3) of stably selected cells. (C, D) Relative colony-forming efficiency of stably selected HEK293 cells (C, normalized to pEPI-1- [CMV-IEP]- [EGFP-IRES-BSD]-ΔMARS) or NIH3T3 cells (B, normalized to pEPI-1- [hCMV/EF1P]- [EGFP-IRES-BSD]-ΔMARS. All vectors contain the EGFP-IRES-BSD transgene transcription unit. Mean values of n = 8 derived from four independent experiments ± SD are shown; * p < 0.05; ** p < 0.001 (two-tailed Student's t-test). mock: untransfected control. n.d.: no stable mixed-clones obtained after transfection and blasticidin selection. Grey bars: vectors containing the hCMV/EF1 promoter element; black bars: vectors containing the CMV-IEP promoter element.

