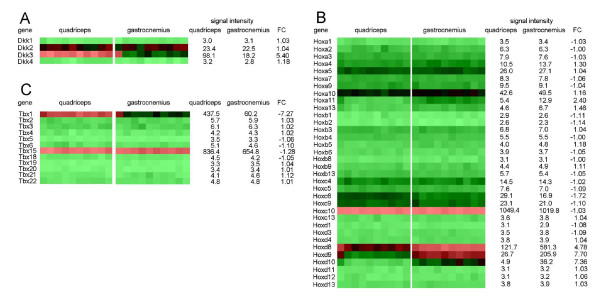
Figure 2.
Heatmap of Dkk genes, Hox genes and Tbx genes in gastrocnemius and quadriceps. Heatmap of the log-transformed microarray signal intensity values of (A) Dkk genes, (B) Hox genes and (C) Tbx genes in the quadriceps and the gastrocnemius of 10 LFD mice. A heatmap was generated by using GeneMaths XT software. Signal intensities are shown by a color range; bright red, black, and bright green represent high, average, and low levels of gene expression, respectively. Values are means (n = 10)

