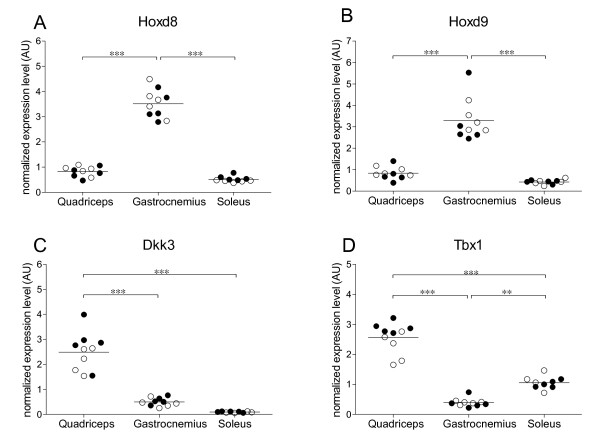
Figure 3.
Expression of Hoxd8, Hoxd9, Dkk3 and Tbx1 in quadriceps, gastrocnemius and soleus. Gene expression levels of (A) Hoxd8, (B) Hoxd9, (C) Dkk3 and (D) Tbx1 in quadriceps, gastrocnemius and soleus of 20-week LFD mice and 20-week HFD mice. Black dots represent the 20-week LFD mice (n = 5); open dots represent the 20-week HFD mice (n = 5), lines represent grand mean values. *** Indicate significant differences with p < 0.001 obtained with two-way ANOVA

