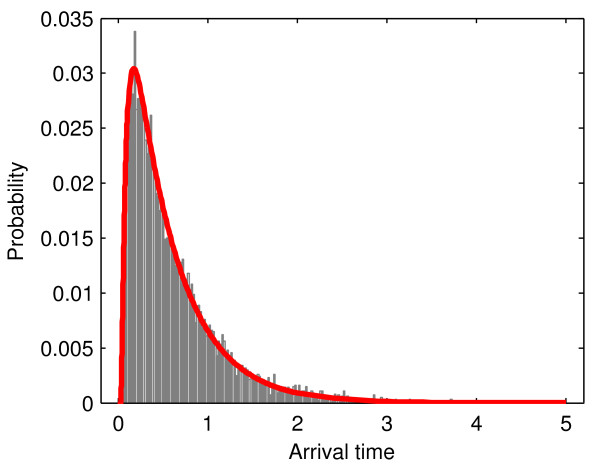
Figure 1.
Distribution of particle absorption times in a 1D discretized space. The interval has size 3.52 μm. Initially a particle starts in 0.81 μm distance to the right boundary and diffuses with step-size 0.001 μm. The left boundary (at 0) is absorbing while the right boundary is reflecting. The normalized histogram over 10,000 random walks showing the number of particles that are absorbed within time intervals of 0.001 seconds is showed in gray. The corresponding numerical solution of dP(ta ≤ t)/dt is plotted as a solid red line.

