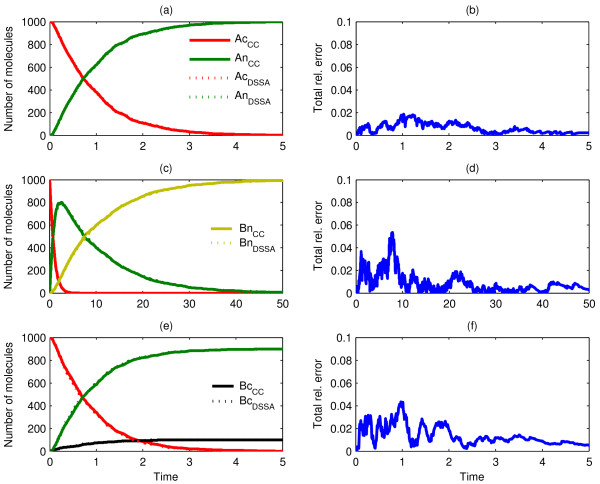
Figure 3.
Comparison of dDSSA and Chemcell: Scenario 1. Single run (a, c) and mean of ten runs (e) of ChemCell as compared to the mean behaviour of ten independent dDSSA trajectories (a, c, e) with corresponding total relative error (b, d, f) for Scenario 1 (a, b), with diffusion constants DAc = 10-7 cm2/sec, Scenario 2 (c, d), with DAc = 10-7 cm2/sec and a reaction rate constant of k = 0.1 s-1, and Scenario 3 (e, f), where DAc = 10-7 cm2/sec and the competing reaction Ac → Bc has a reaction rate constant k = 0.1 s-1.

