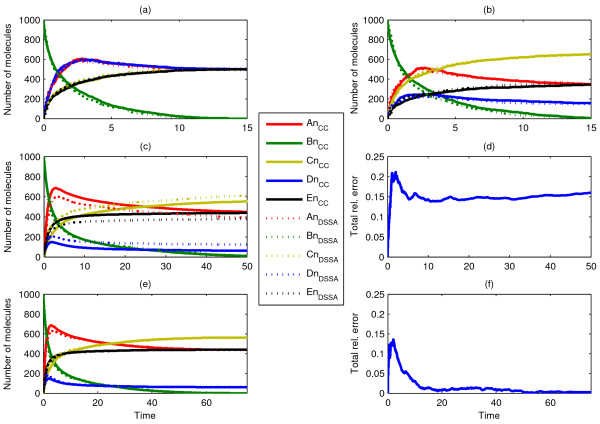
Figure 6.
Comparison of ChemCell and dDSSA trajectories, portraying Scenario 6. Here, delay distributions are obtained from separate ChemCell runs (delay splitting) for each of the two translocation reactions and the competitive binding reactions. Diffusion rates are Dcyt = 10-9 cm2/sec and Dnuc = 10-9 cm2/sec for cytoplasmic and nuclear species, respectively. Cases correspond to different initial conditions: (a) 1000 Ac and 1000 Dc molecules uniformly distributed in the cytosol; (b-d) 1000 Ac and 500 Dc molecules (b) uniformly distributed in the cytosol or (c, e) Ac is clustered and Dc is well mixed, while (d, f) show their corresponding total relative error. All four cases start with 1000 Bn molecules uniformly distributed in the nucleus. In (e, f) we use a modified rate k = 0.015 for An+ Bn → Cn to increase accuracy. To facilitate reading, plots only show nuclear species.

