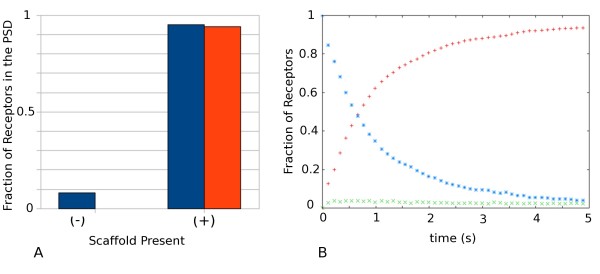
Figure 1.
Incorporation of Receptors into the PSD. (a) Data show fraction of receptors present at the PSD following simulation of 5 seconds of diffusion in the absence (-) and presence (+) of AMPAR binding scaffold entities. Blue, total receptors; Red, receptors bound to scaffold. (b) Fraction of AMPARs bound, unbound in the PSD and in the ESM as a function of time. Red plus, bound; Green times, unbound in PSD; Blue stars, in ESM. Parameters used found in Table 1.

