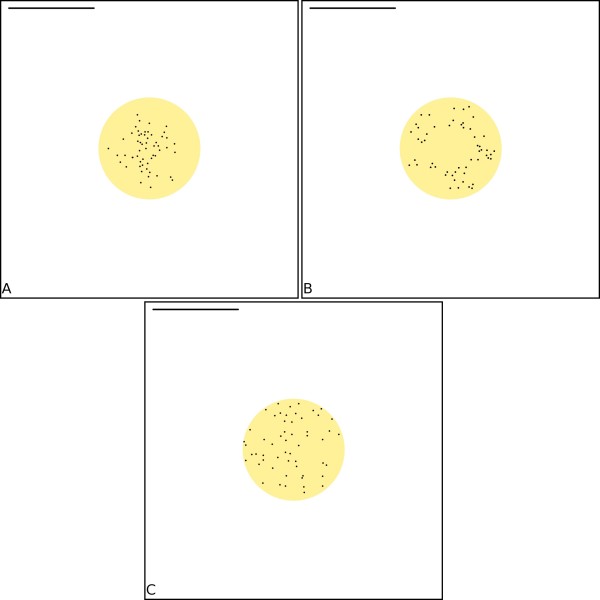
Figure 5.
Schematic representation of model spine and distribution of scaffold elements. (a) Scaffold element position within the PSD drawn from a Uniform distribution (see 'Materials and Methods' for details). (b) Scaffold element position within the PSD drawn from a Annular distribution (see 'Materials and Methods' for details). (c) Scaffold element position within the PSD drawn from a Patch distribution (see 'Materials and Methods' for details). Scale bar is 500 nm.

