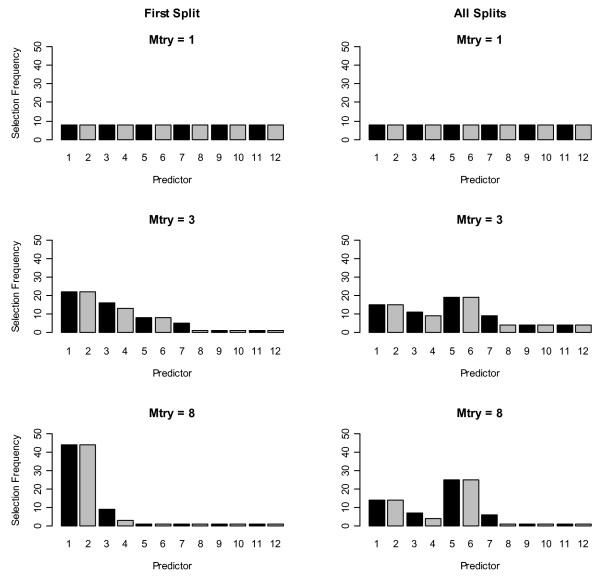
Figure 1.
Histograms of selection frequencies using random forest. First row: number of variables selected at each split (mtry) = 1, 2nd row: mtry = 3, 3rd row: mtry = 8. First column shows the first split selection frequencies and 2nd column shows the selection frequencies across all trees in all forests.

