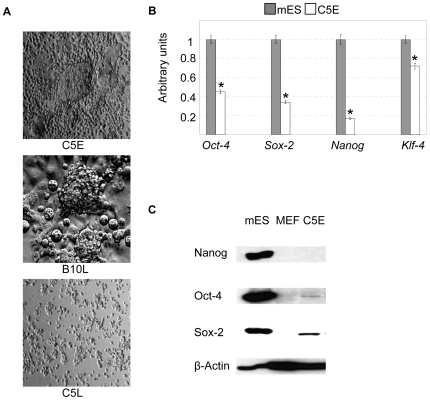
Figure 1. Morphological features and expression of pluripotency genes in cell lines derived from rat blastocysts.
(A): Morphology of cell line C5E, B10L and C5L, photos were made with 10× objective (C5E and C5L) and 20× objective (B10L). (B): Real-time PCR analysis of Oct-4, Sox-2, Nanog, KLF-4 gene expression in C5E and mES cells. The data were normalized by the amount of β-actin and plotted against the expression level in mES cells set as 1.* p<0.01 vs. mES cells; AU, arbitrary units. (C) Western-blot analysis of Oct-4, Nanog and Sox-2 protein levels in mES cells (positive control), MEF (negative control) and C5E.

