Figure 2.
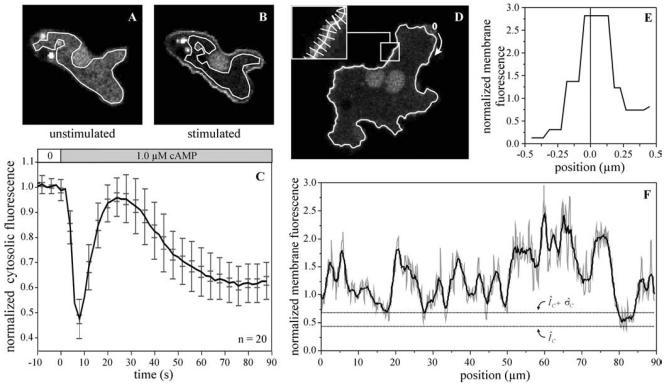
Quantification of fluorescence intensity in the cytosol and along the cell boundary. A representative cell before and 8 s after stimulation with 1 μM cAMP is shown in panels A and B, respectively. An area of the cytosol was selected that is devoid of the nucleus and large vesicles. The mean fluorescence intensity in the selected area was determined and is presented in C as relative fluorescence at different times after stimulation with cAMP. The results shown are the means and SD (large bars) or SE of the mean (small bars) of 20 cells. (D) The boundary contour of the cAMP-stimulated cell. On this contour thousand short perpendicular lines were positioned (inset in D); the fluorescence intensity along one line segment is presented in E. The fluorescence intensity along the membrane was determined for the 1000 boundary points as described in MATERIALS AND METHODS and is presented in F. The thin gray line represent the original data, which are smoothed by adjacent averaging in the black line. ÎC + σ̂C refers to the fluorescence intensity of the cytosol ÎC and the SD σ̂C. The 0-position and direction are indicated by the arrow in D.

