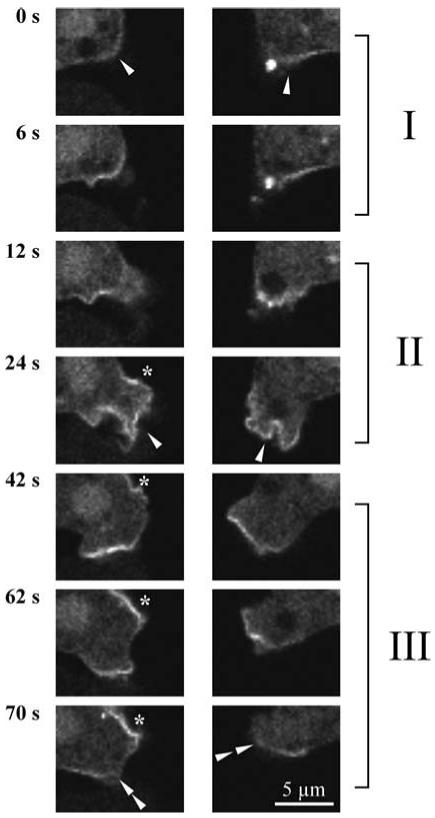
Figure 6.
Correlation between PHCrac-GFP patches and pseudopodia. The life cycles of two patches are presented that appear ∼35 s after stimulation with 1 μM cAMP. Phase I, onset of patch formation. The first appearance of increased levels of PHCrac-GFP at the boundary is indicated by the arrow at t = 0 s; the patch grows during the next 10 s. Phase II, protrusions and pseudopod extension occurs at the location of the PHCrac-GFP patch (arrow; the asterisk at 24 s indicates the start of a new patch). Phase II termination of the patch and retraction of the pseudopod. At about 60 s the patch reduces in size and disappears, and the pseudopod is retracted (double arrow).

