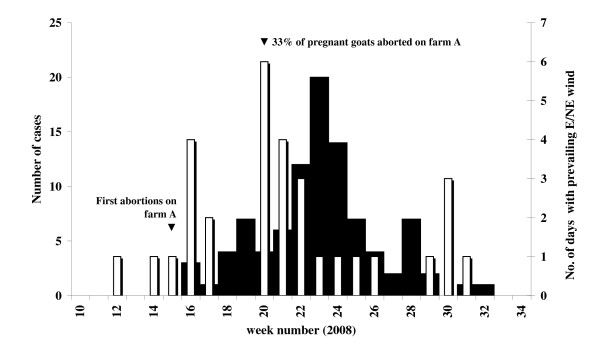
Figure 1.
Epidemic curve of Q-fever and wind direction. Number of Q-fever cases in the Municipal Health Service region Brabant Southeast by week of illness onset (n = 95, black bars); and number of days in the week with prevailing eastern or north-eastern wind (white bars). Information on date of illness onset is missing for one case.

