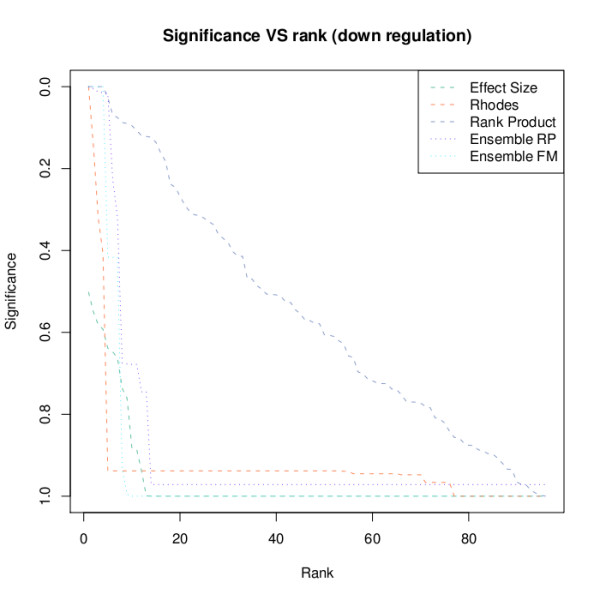
Figure 1.

FDR vs rank plot for under expressed features. For visualizing the outcome of a meta-analysis, one often wants to plot the reported significances against their ranks. The function plotFDR enables this to be carried out in a simple manner, combining information from various methods. Coloring and selection of the line types is carried out automatically according to whether a reported result comes from a single study analysis, a meta-analysis, or an ensemble approach.
