Fig. 7.
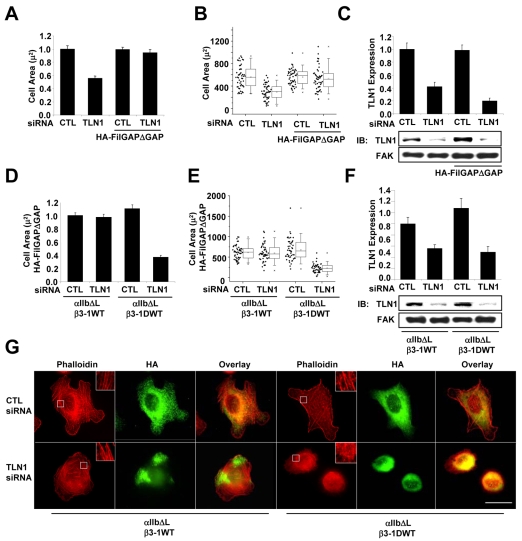
Expression of FilGAPΔGAP restores spreading and stress fiber formation in cells adhered by integrins containing the β1A tail, but not the β1D tail. CHO K1 cells were transiently transfected with control or TLN1 siRNA#1 for 48 hours, and then co-transfected for 24 hours with expression vectors for αIIlb-ΔL together with β3-1A WT integrin subunits with or without HA-FilGAPΔGAP. Aliquots of transfected cells were used to confirm knockdown and to assay spreading following adhesion to fibrinogen for 1 hour in CCM1. (A) Plotted is the average cell area ± s.d. from three independent experiments, n=150. (B) Areas of individual cells from one of these experiments depicted in a box and whisker plot (*P<0.05). (C) The efficiency of talin-1 knockdown was determined by western blotting. Plotted is the mean expression level of the indicated proteins ± s.d. (D) CHO K1 cells were transiently transfected with control or TLN1 siRNA #1 for 48 hours, and then co-transfected for 24 hours with expression vectors for αIIlb-ΔL together with either the β3-1A WT or β3-1D integrin subunits with or without HA-FilGAPΔGAP. Aliquots of transfected cells were used to confirm knockdown and to assay spreading and stress fiber formation following adhesion to fibrinogen for 1 hour in CCM1. Plotted is the average cell area ± s.d. from three independent experiments, n=150 of cells transfected with HA-FilGAPΔGAP. (E) Areas of individual cells from one of these experiments depicted in a box and whisker plot (*P<0.05). (F) The efficiency of talin-1 knockdown was determined by western blotting. Plotted is the average expression level of the indicated proteins ± s.d. (G) Representative images of cells stained with monoclonal antibody HA to visualize FilGAPΔGAP positive cells (green) together with phalloidin for actin filaments (red). Scale bar: 20 μm.

