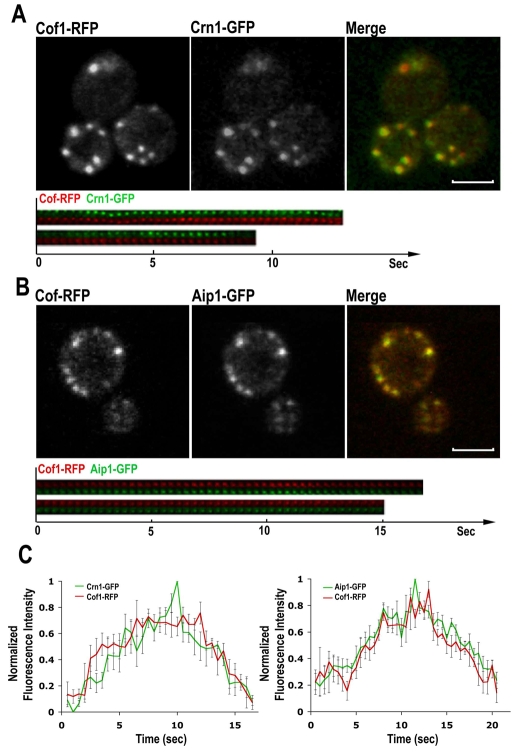
Fig. 2.
Timing of cofilin, coronin and Aip1 localization to actin patches. (A,B) Single-frame images from a confocal time-lapse movie of cells expressing Cof1-RFP and Crn1-GFP (A) or Aip1-GFP and Cof1-RFP (B). Scale bars: 3 μm. (C) Mean fluorescence intensity (green and red lines) of cortical actin patches from cells in A (n=5) or B (n=10) were plotted over time. Error bars indicate s.e.m. Images were collected at room temperature.

