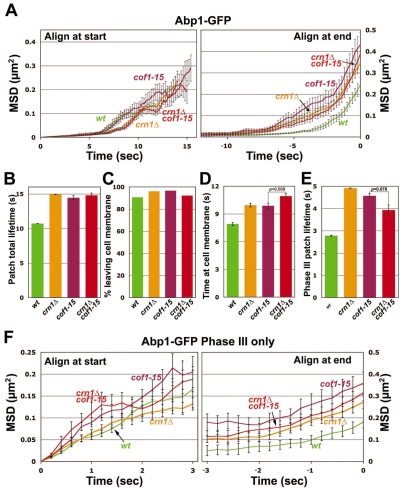
Fig. 5.
Quantitative motion analysis of Abp1-GFP-labeled actin patches in wild-type, cof1-15, crn1Δ and cof1-15 crn1Δ cells. (A) Mean-squared displacement (MSD) plots for patches aligned at the start (left) or end (right) of their lifetimes. On the left, the curves are truncated at the median lifetime. (B) Average total lifetime of patches, defined as the time from the appearance of a patch until its disappearance. (C) Percentage of patches that leave the membrane, defined as traveling >200 nm from their point of origin. (D) Average time spent by patches within 200 nm from their point of origin. (E) Average lifetime of patches after they travel 200 nm from their point of origin until the time they disappear (Phase III lifetime). (F) MSD plot of Phase III patch movement. For each patch, only data for travel more than 200 nm from the point of origin were included. Means ± s.e. of three segregants are shown. Student's t-tests for statistical significance were performed in D and E, as indicated. Strains and numbers of patches were as follows: wild type: YJC6537 (n=41), YJC6538 (n=43) and YJC6543 (n=29); crn1Δ: YJC6779 (n=33), YJC6780 (n=42) and YJC6781 (n=31); cof1-15: YJC6536 (n=19), YJC6541 (n=29) and YJC6542 (n=23); crn1Δ cof1-15: YJC6920 (n=60), YJC6921(n=30) and YJC6922 (n=65).

