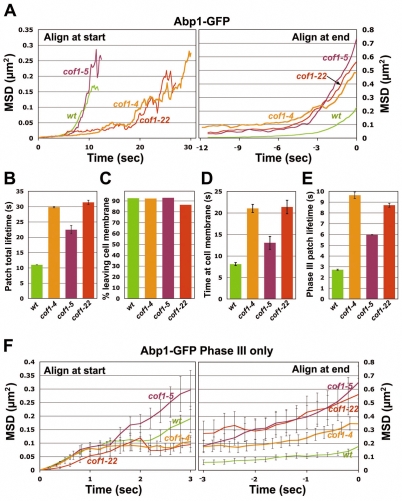
Fig. 8.
Quantitative motion analysis of Abp1-GFP-labeled actin patches in wild-type, cof1-4, cof1-5 and cof1-22 cells. (A-F) Panels are as described for Fig. 5. Strains and numbers of patches are as follows: wild-type: YJC6516 (n=85), YJC6521 (n=85) and YJC6522 (n=77). cof1-4: YJC6515 (n=17), YJC6519 (n=27) and YJC6520 (n=28); cof1-5: YJC4439 (n=33), YJC4440 (n=11) and YJC4441 (n=9); cof1-22: YJC4427 (n=25), YJC4428 (n=9) and YJC4429 (n=11).

