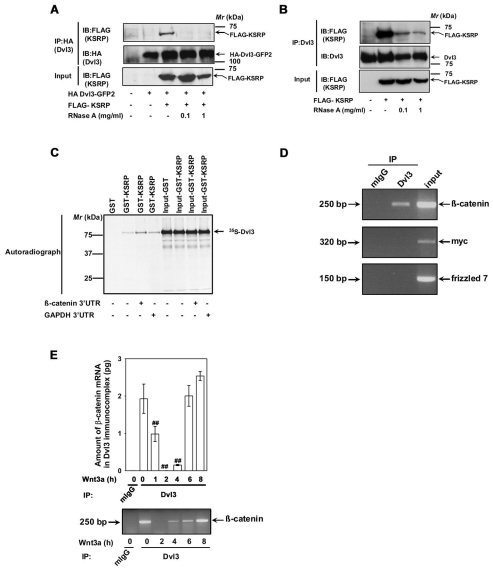
Fig. 5.
Dvl3-KSRP interaction is RNA dependent and Dvl3 complex harbors Ctnnb1 mRNA. (A) F9 cells were co-transfected with HA-Dvl3-GFP2 and FLAG-KSRP for 24 hours followed by cell lysis. The lysates were then incubated without or with indicated amounts of RNaseA at room temperature for 10 minutes followed by affinity pull-downs with anti-HA affinity matrix. Interaction of KSRP with exogenous Dvl3 was probed by immunoblotting with anti-FLAG antibodies. (B) F9 cells were transfected with FLAG-KSRP for 24 hours followed by cell lysis. The lysates were then incubated without or with indicated amounts of RNaseA at room temperature for 10 minutes followed by affinity pull-downs with anti-Dvl3 antibodies. Interaction of KSRP with endogenous Dvl3 was probed by immunoblotting with anti-FLAG antibodies. (C) To test whether the in vitro interaction of KSRP and Dvl3 is also RNA dependent, in vitro synthesized 35S-labeled Dvl3 was used in pull-down experiments with either GST or GST-KSRP-Sepharose beads in the absence or presence (5 μg) of either 3′-UTR of Ctnnb1 or Gapdh. The interaction was visualized by SDS-PAGE and autoradiography. (D) RNA immunoprecipitation assay was performed on F9 cell lysates with either control mouse IgG or anti-Dvl3 antibodies. The RNA isolated from the immunoprecipitates was analyzed by RT-PCR with primers specific for Ctnnb1, Myc or Fzd7. Representative gel of two independent experiments that proved highly reproducible is displayed. (E) F9 cells were treated with Wnt3a (10 ng/ml) for indicated periods of time and RNA immunoprecipitation assay was performed with either control mouse IgG or anti-Dvl3 antibodies. The RNA isolated from the immunoprecipitates was analyzed by quantitative real-time PCR with β-catenin specific primers. Representative blots of two independent experiments that proved highly reproducible were displayed. The data represent mean values ± s.e.m. from two independent experiments whose results were in high agreement. In the lower panel, a representative gel is displayed. ##P<0.01 versus the control (−Wnt3a).

