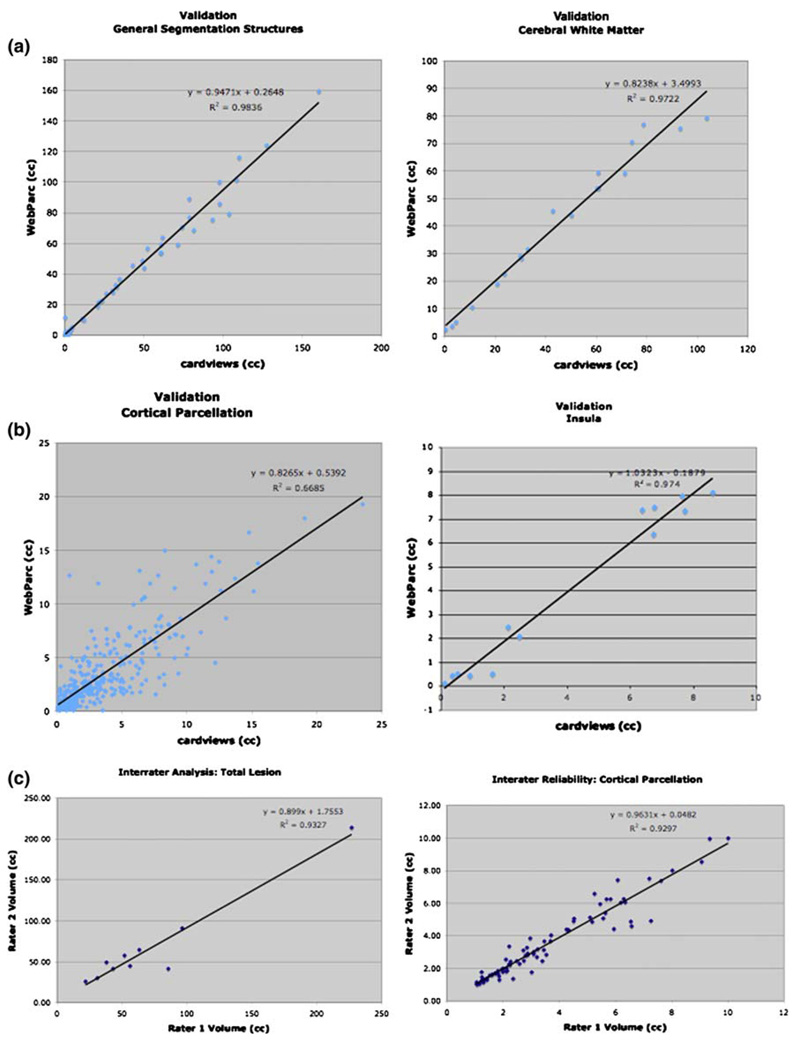
Fig. 5.
cardviews–WebParc regression plots. a “General segmentation”: regression for all (N = 67) general segmentation measures across all subjects (left) and regression for the volume estimate of cerebral white matter involvement across the 21 subjects (right). b Cortical parcellation: regression for all (N = 336) parcellation unit measures across all subjects (left) and regression for the volume estimate of insula involvement across the 16 of the 21 subjects that had involvement of this region (right). c Intrarater correlation plots for total lesion (left) and all parcellation units (right). Note that the r2 value for the intrarater correlation plots for total lesion plot goes to 0.356 when the large lesion is excluded

