
Fig. 10.
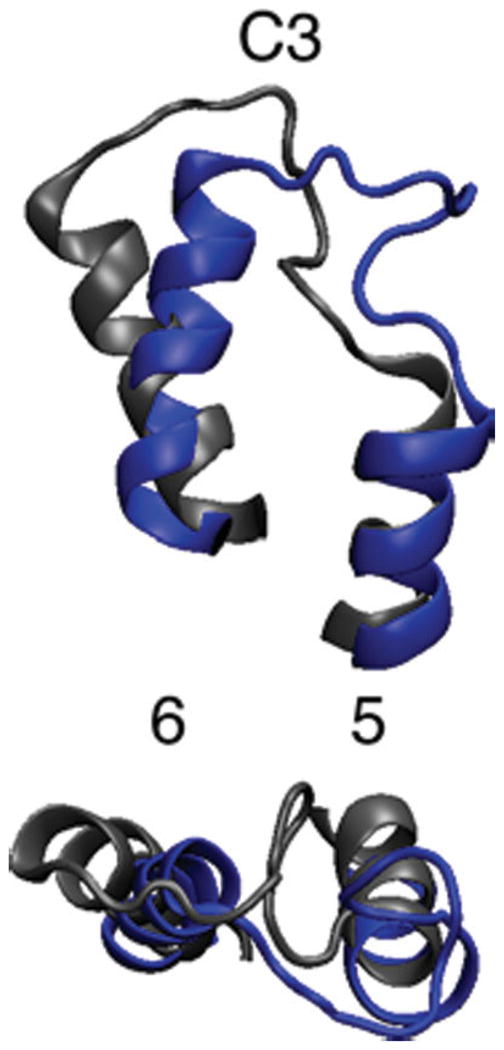
Rhodopsin’s C3 loop in dark state (gray) and after 150 ns of simulation (blue).34 Bottom image is 90° rotation of top image. The label 5 and 6 identify the respective transmembrane helices.
Official websites use .gov
A
.gov website belongs to an official
government organization in the United States.
Secure .gov websites use HTTPS
A lock (
) or https:// means you've safely
connected to the .gov website. Share sensitive
information only on official, secure websites.
Rhodopsin’s C3 loop in dark state (gray) and after 150 ns of simulation (blue).34 Bottom image is 90° rotation of top image. The label 5 and 6 identify the respective transmembrane helices.