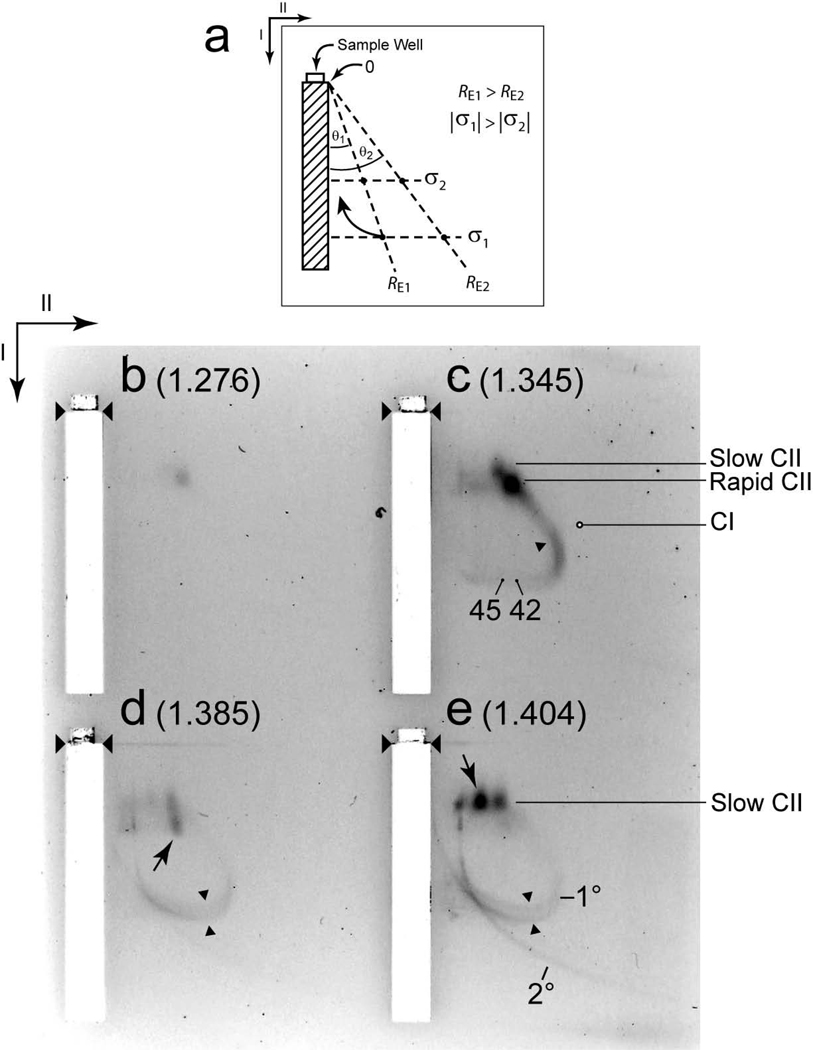
Figure 3.
Two-dimensional, non-denaturing agarose gel electrophoresis (2d-AGE). (a) A diagram illustrates 2d-AGE. Wild type samples with the following densities (g/ml) were subjected to 2d-AGE with staining by GelStar: (b) 1.276, (c) 1.345, (d) 1.385, (e) 1.404. The first and second dimension gels were all embedded in one agarose slab. Thus, all four samples were co-fractionated, thereby assuring the same field and temperature among them. The samples come from the gradient in Figure 2a. The arrows indicate the directions of the first (I) and second (II) electrophoresis. The unnumbered arrowheads indicate the origins of electrophoresis. The purposes of both the numbered arrowheads and other markings are described in the text.

