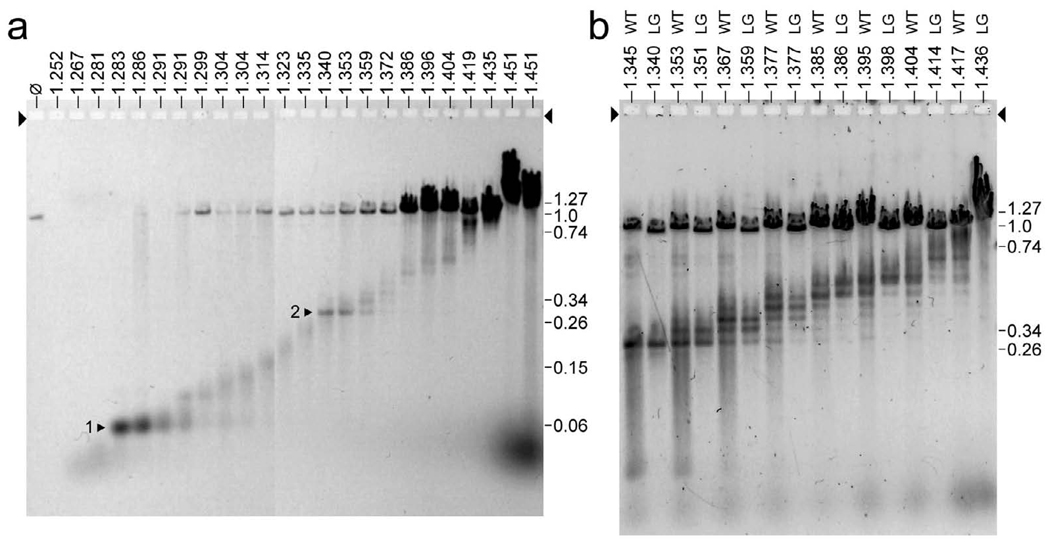
Figure 6.
The ipDNAs. After a fractionation like the fractionation in Figure 2a, DNA was expelled from the ipDNA-capsids in each fraction. Then, the ipDNAs were separated by gel electrophoresis. (a) ipDNAs from an entire density gradient of wild type T3, with the density of a fraction indicated at the top (g/ml), (b) ipDNAs from the 1.345–1.436 g/ml region of the density gradients of both wild type T3 (lanes marked WT) and the T3-LG114 mutant (lanes marked LG), with the density of a fraction indicated at the top. An arrow indicates the direction of electrophoresis; arrowheads indicate the origins of electrophoresis. In order to have enough lanes, results from two ethidium stained gels run in parallel are combined in (a); the gel in (b) was stained with GelStar.

