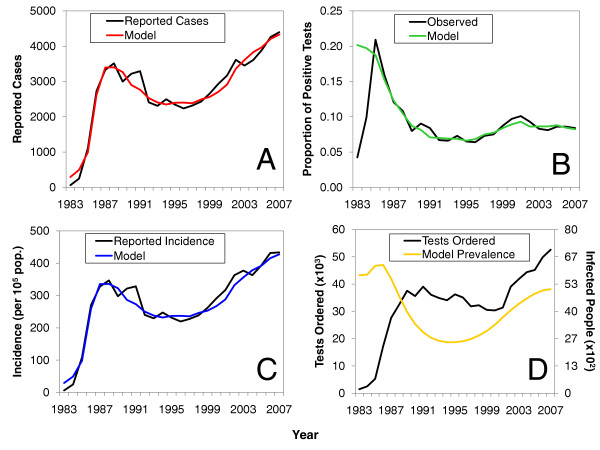
Figure 3.
Comparison of model calibrations to observed trends. Calibrated numbers of (A) cases from the models compared to reported numbers of cases in Saskatchewan. Parts (B) and (C) cross-check the model to the observed proportion positive among those tested (B), and the reported incidence (per 100,000 population) (C). Model-generated curves in parts (A), (B), and (C) were arbitrarily chosen from 50 million optimization simulations. Part (D) is a visual comparison of testing volume between 1983 and 2007 to the "actual" prevalence in Saskatchewan generated by the model.

