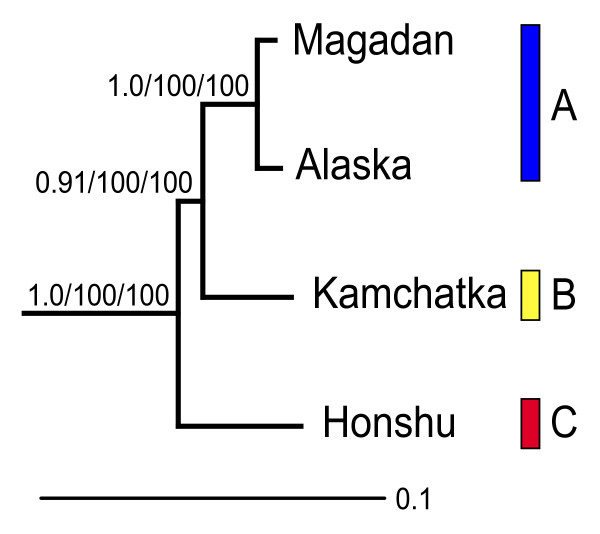
Figure 3.
Relationships among the three main clades. Relationships of representatives from each of the three main clades in Figure 2, estimated by Bayesian inference of concatenated mitochondrial ND5, cytochrome b, control region, tRNA-Pro, ND6, tRNA-Glu, tRNA-Phe and 12S sequences (3.2 kbp), under the HKY + I model. Support values at the nodes are, from left to right, posterior probability, maximum likelihood bootstrap and parsimony bootstrap. Clade names (A, B, C) same as in Figure 2.

