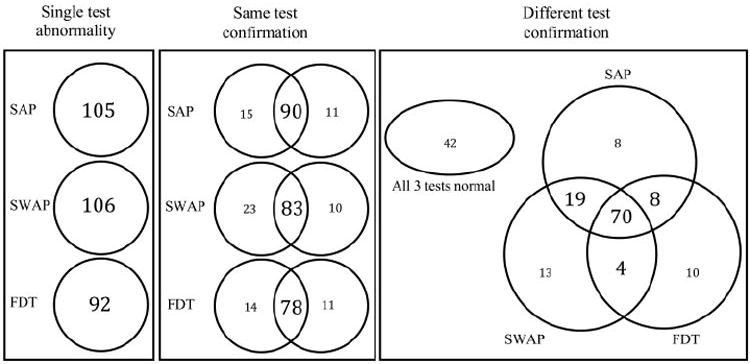
Figure 2.

Venn diagrams show the number of patients with GON (n = 174) with abnormal visual field results for single-test abnormalities (left), same-test confirmation (middle), and different-test confirmation (right). The numbers presented for SAP, SWAP, and FDT are based on the machine-derived PSD triggered at 5%.
