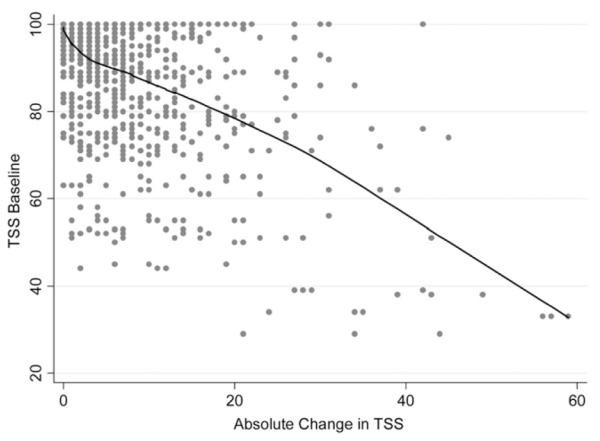
FIGURE 2.

Scatterplot showing the relationship between absolute change in TSS over time and baseline TSS scores. Lower TSS scores at baseline had greater absolute changes in TSS scores over time. A LOWESS shows that the relationship was approximately linear.
