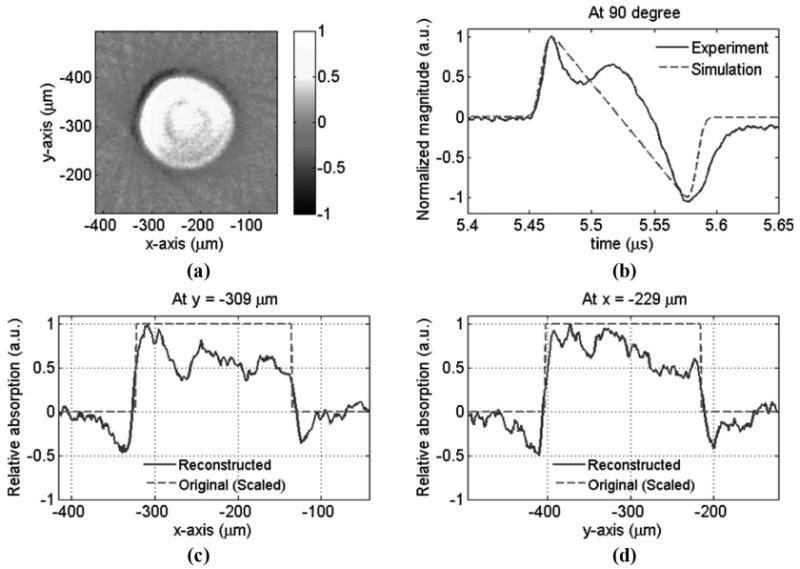
Fig. 9.

Photoacoustic tomography of a 301-μm bead: (a) reconstructed image, (b) measured and simulated acoustic signal at one particular angle, (c) the line profile of the reconstructed image at y = −309 μm, and (d) the line profile of the reconstructed image at x = −229 μm. The center of the bead's image is at about x = −229 μm and y = −309 μm.
