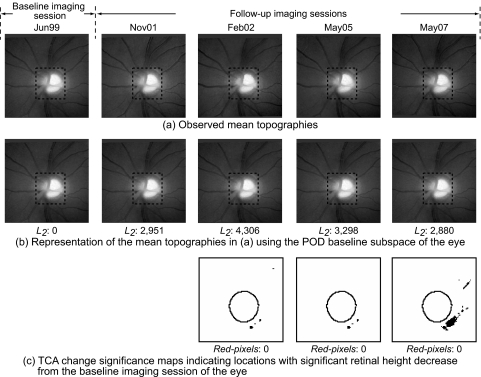
Figure 3.
HRT-II follow-up examinations of a normal subject. In the POD framework, summary parameters were calculated by comparing the topographic measurements within the optic disc region (marked by dotted rectangles in a and b) in the observed follow-up topographies (a) with their respective baseline subspace representations (b). It can be visually observed that the follow-up topographies in (a) appear more similar to their baseline subspace representations in (b) indicating less change from baseline. Quantitatively, the L2 norm of 2,880 in the last follow-up of the normal subject in (b) is lower (indicating less change) than the L2 norm of 20,974 in the last follow-up of the progressor shown in Fig. 4b). For TCA, the red pixel count within the optic disc margin (c) was used to identify the degree of change from baseline.

