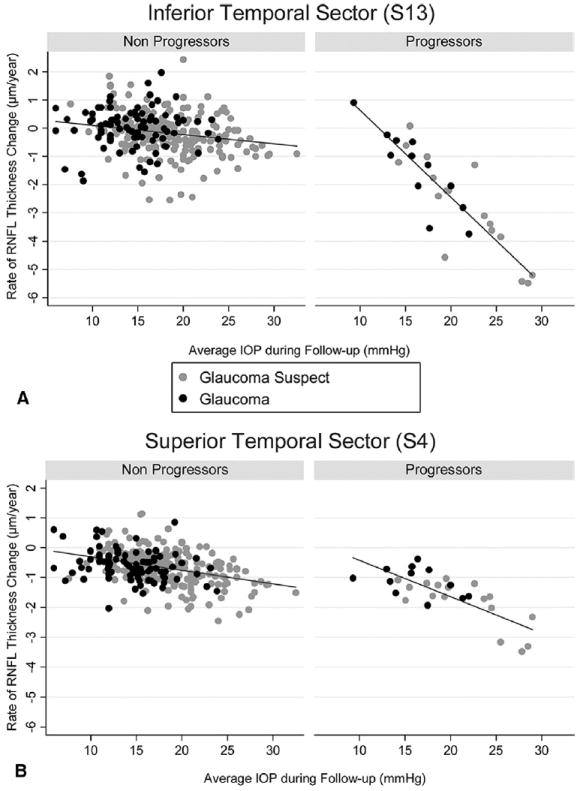
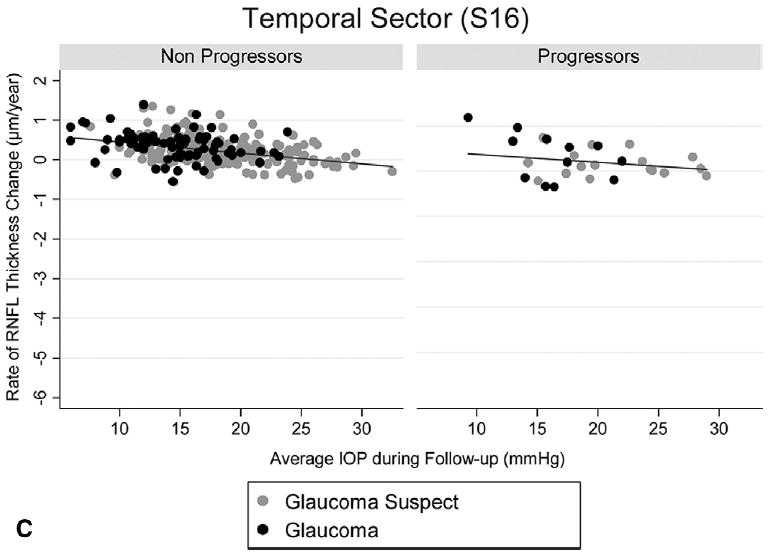
Figure 4.


Scatterplots illustrating the relationship between intraocular pressure (IOP) and rates of change in the scanning laser polarimetry with enhanced corneal compensation for the inferior temporal (A, S13), superior temporal (B, S4), and temporal sectors (C, S16). Rates of change are shown for eyes that progressed by visual fields and/or stereophotographs (progressors) as well as for eyes that did not (nonprogressors). RNFL = retinal nerve fiber layer.
